
Is Badaling snowsure?
The snowiest week in Badaling is week 1 of November. There are typically 0.2 snowy days during this week with 2 cm of snowfall. Check out the Badaling Snow History graphs below. Select any week of the year to see the typical Ski Conditions, Snowfall Amount and Temperature based on nowcast weather data over the last 11 years.Average monthly snow in Badaling
| Month | Snow amount (week) | Snow days (week) |
|---|---|---|
| December | 0 cm | 0.2 days |
| January | 1 cm | 0.2 days |
| February | 1 cm | 0.4 days |
| March | 1 cm | 0.2 days |
| April | 0 cm | 0.0 days |
Average Snow and Weather Conditions in Badaling during September (week 4):
The average snowfall forecast during week 4 of September for Badaling is 0 cm. There are typically 0.0 snowy days during this week. Badaling normal weather and snow conditions during the last week of September at the middle elevation of the ski area at 244m, based on historical averages over the last 18 years: At this time of year the normal freezing level (3411m) is far above the mid altitude of Badaling. Snowfall is highly unlikely in Badaling at the end of September but on average there are one or two wet days during this week every year. Warm day temperatures in Badaling during week four of September. The average temperature range is between 17.5°C and 20.4°C at the mid altitude. Often sunny. Expect sunshine on four or five days. Generally light winds (average 7km/h).
Snow History: Compare Resorts
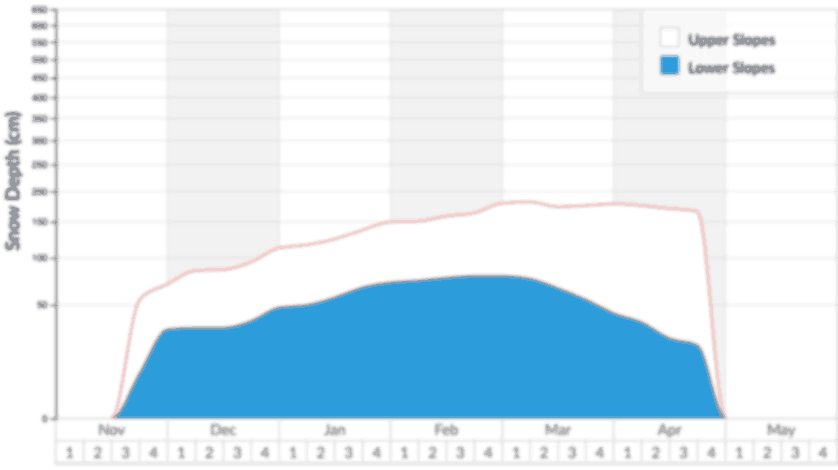
Badaling Snow Depths
Recorded snow depths for the upper and lower slopes in Badaling and (2007 – 2026).
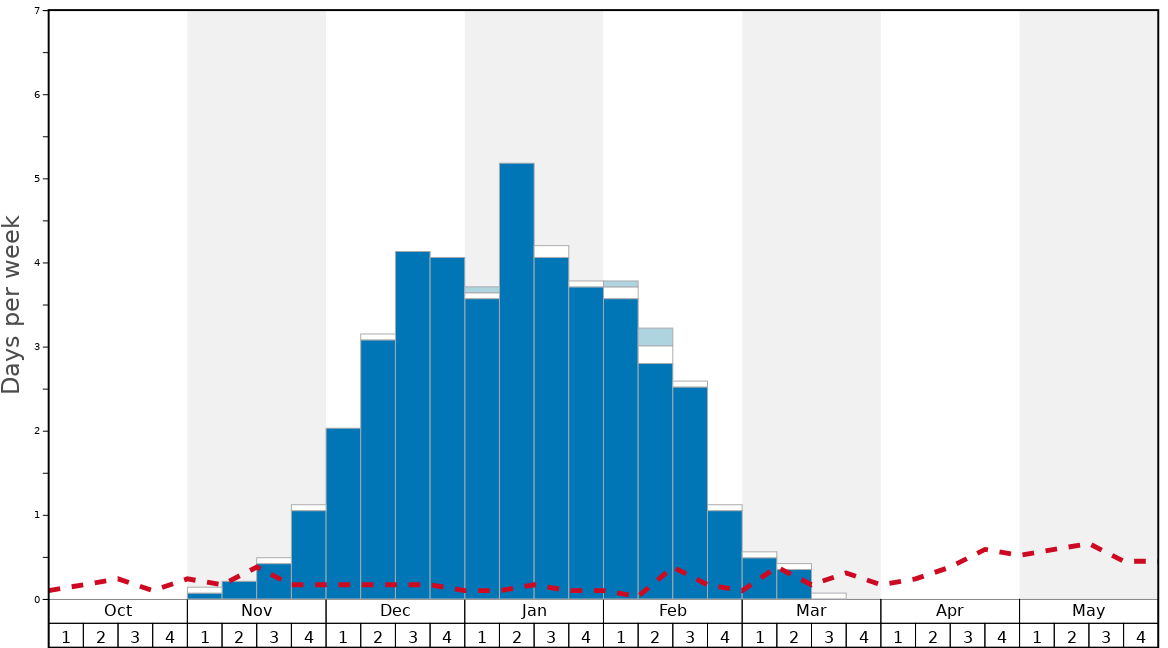
The most cherished days on the mountain in Badaling are Bluebird Powder days when it is mostly sunny with light winds following very recent snowfall. Poorer weather conditions may prevail on Powder days when the visibility can be limited but the snow is significantly deep and fresh for keen powder-hounds. Bluebird days can suit many skiers that aren’t necessarily hunting powder but want to enjoy the snowy mountains in sunnier conditions and light winds.
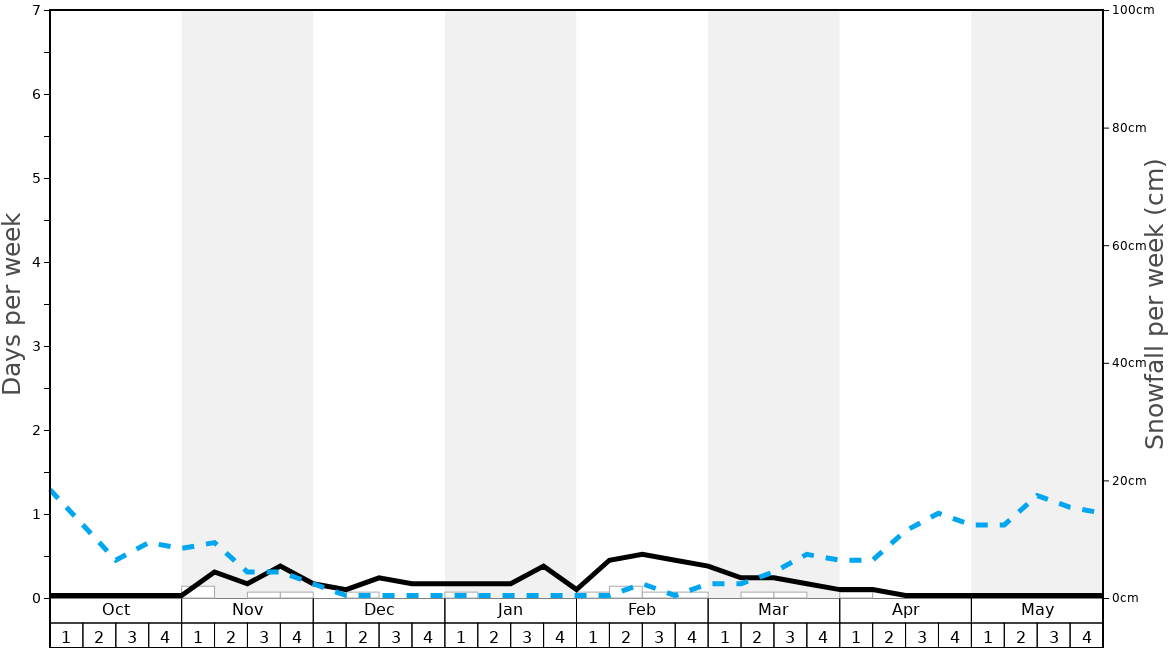
The snowiest weeks of the year in Badaling are shown but also bear in mind the number of days that it typically snows each week if you want regular fresh tracks. The risk of a rainy day is shown but be sure to switch between elevations to see if lower lifts are rain affected or higher lifts remain snowy despite any rain further down the mountain.
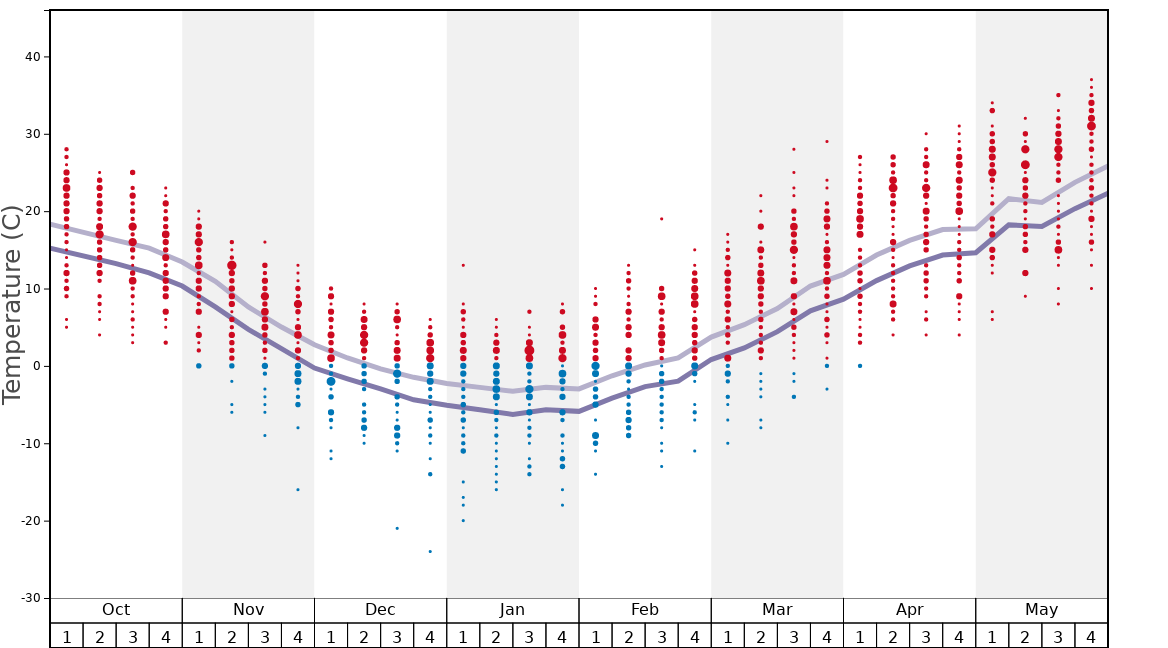
The highest and lowest temperatures averaged for each week of the year in Badaling are shown. Check out the risk of freze-thaw conditions prevailing at different elevations for any given week. We also show the extremes of temperature (blue/red dots) that reveal the chance of unusually warm or cold conditions.
 Nearest